𝗧𝗵𝗲 𝗦𝗲𝗿𝗶𝗲𝘀 𝗔 𝗙𝘂𝗻𝗱𝗿𝗮𝗶𝘀𝗶𝗻𝗴 𝗧𝗼𝗼𝗹𝗸𝗶𝘁
A full guide to Series A fundraising, including real pitch decks that raised millions, a cap table & exit model template, a Business Plan and financial model calculator, and Series A benchmark metrics


Hey! My name is Javier López, and I’m a Venture Capital investor at GoHub Ventures, an early-stage fund with €90M AUM investing from pre-seed to Series A internationally.
After reviewing 1,200+ startups this year, I wanted to share a detailed guide on how VCs actually evaluate your startup.
To make it more complete, I’ve teamed up with my friend Javier Martínez, who’s seen the game from both sides: from the investor’s perspective as an investment banker, corporate development manager, and advisor at GoHub, to now leading from the inside as the CFO of a Series A startup.
Together, we’ll be publishing a series of posts going stage by stage, explaining how investors evaluate companies at each phase, from the earliest pre-seed rounds all the way to private equity and even the M&A perspective.
We’ll also share a set of resources and tools we believe can help founders as they prepare for each round.
In today’s newsletter…
We’ll break down how VCs evaluate Series A startups once the bar shifts from potential to proof…
What’s inside:
👉 A practical guide to what main aspects VCs focus on when reviewing Series A companies
👉 Clear benchmarks for the key metrics VCs expect to see at this stage, and what “good” actually looks like
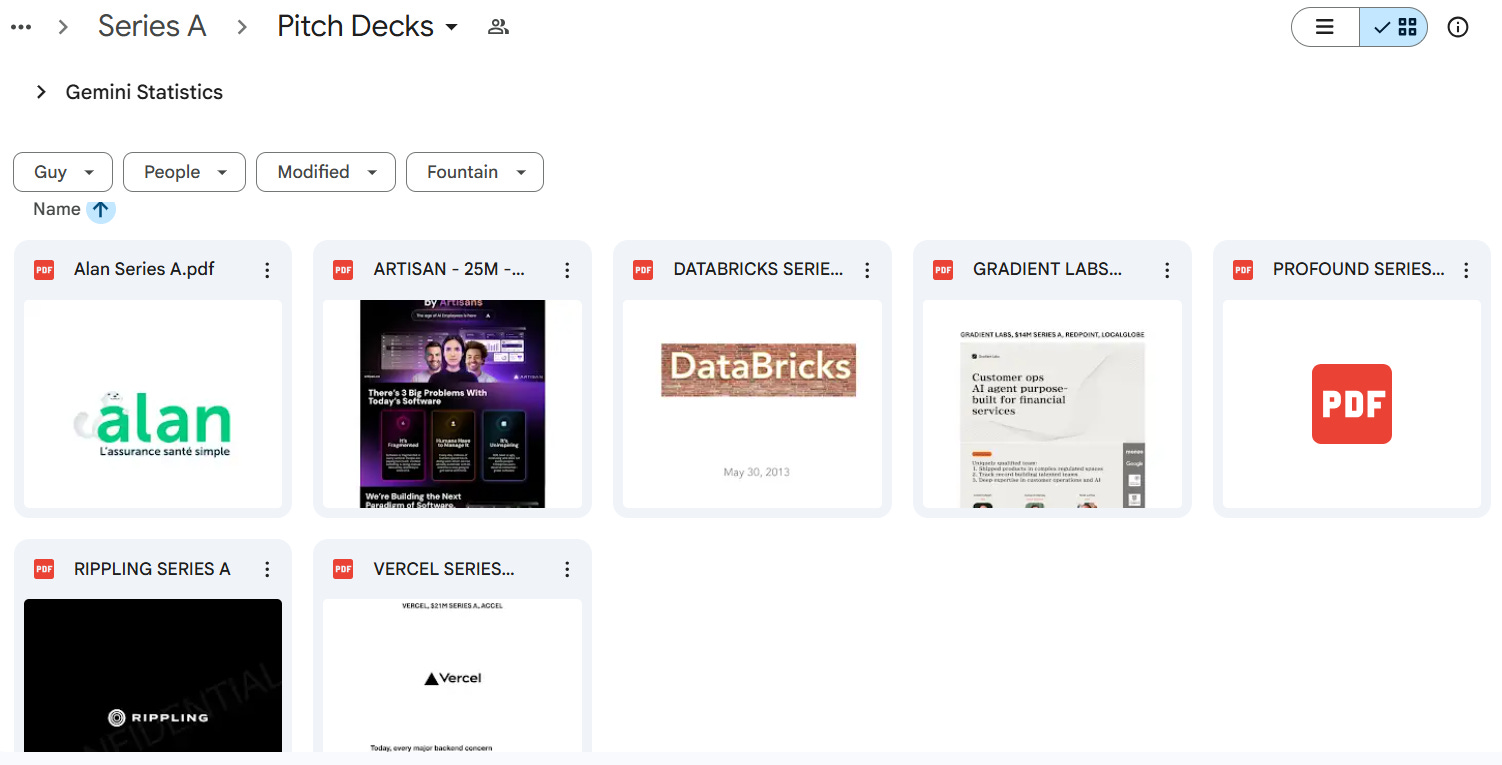
👉 Pitch decks that companies like Vercel, Databricks, Alan, Profound, and Artisan, used to raise their Series A from tier-1 investors
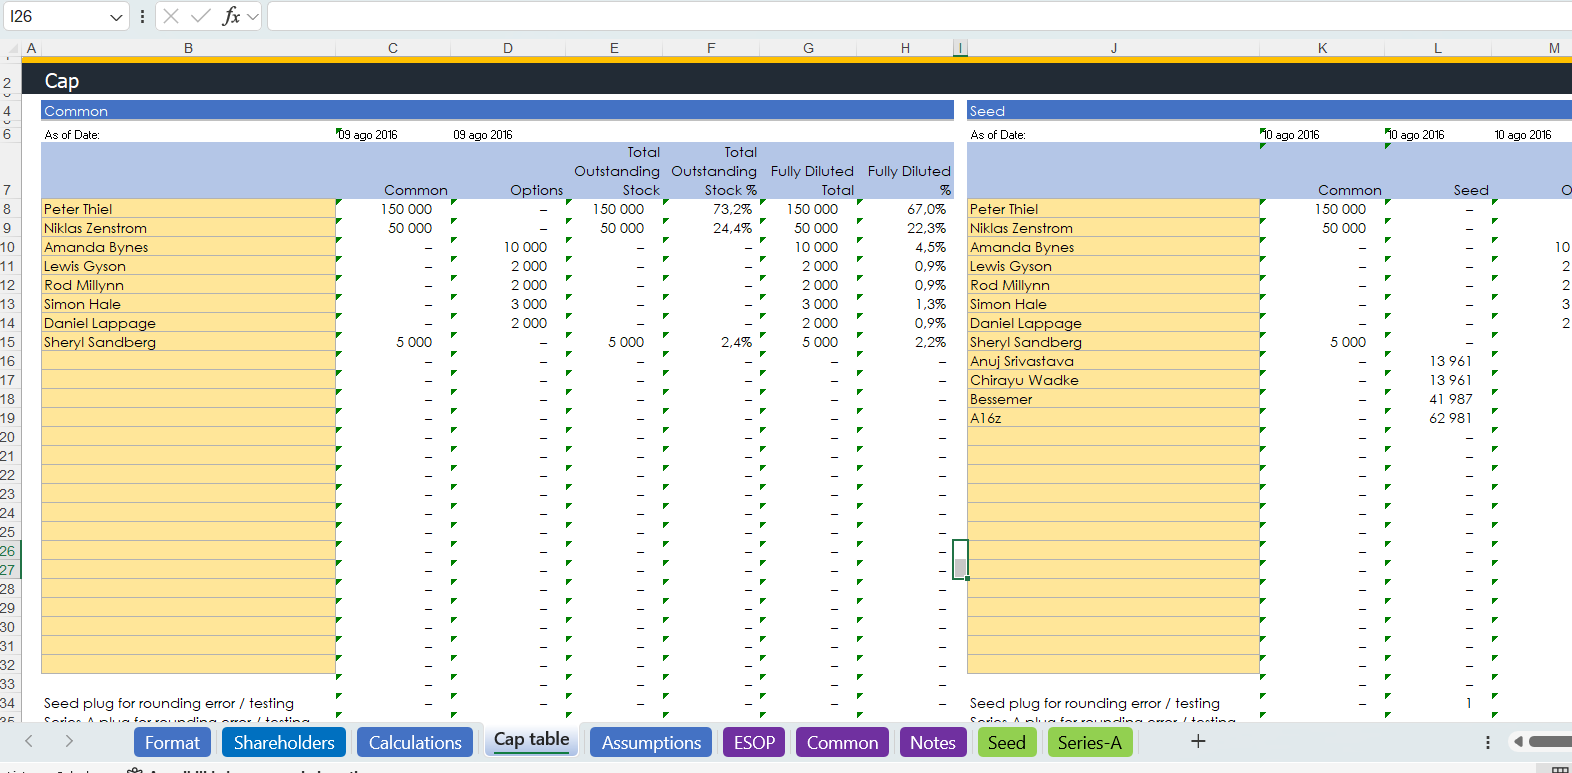
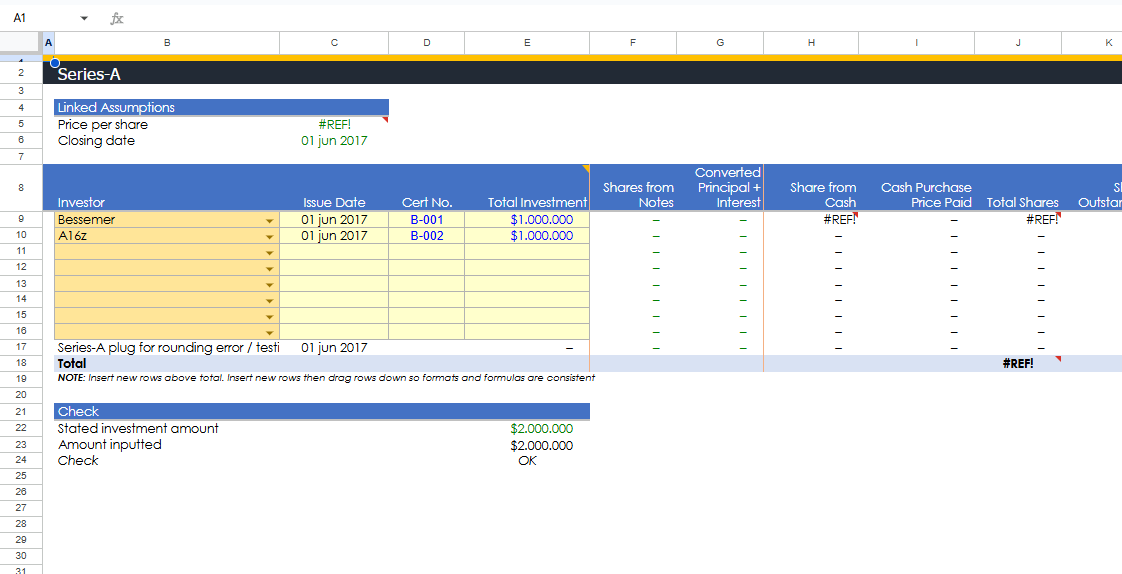
👉 A Series A Cap Table Calculator (Excel) to model dilution, ownership, and exit outcomes
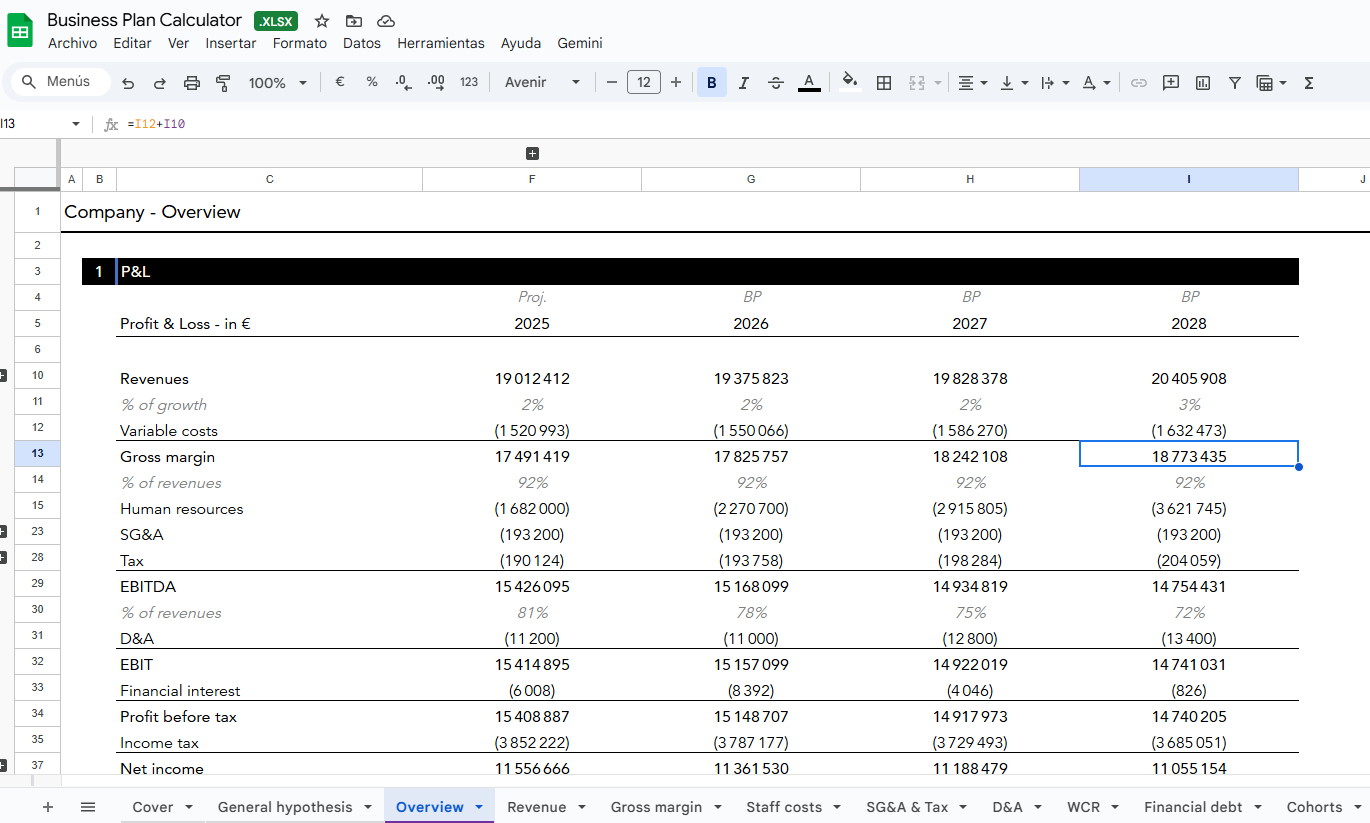
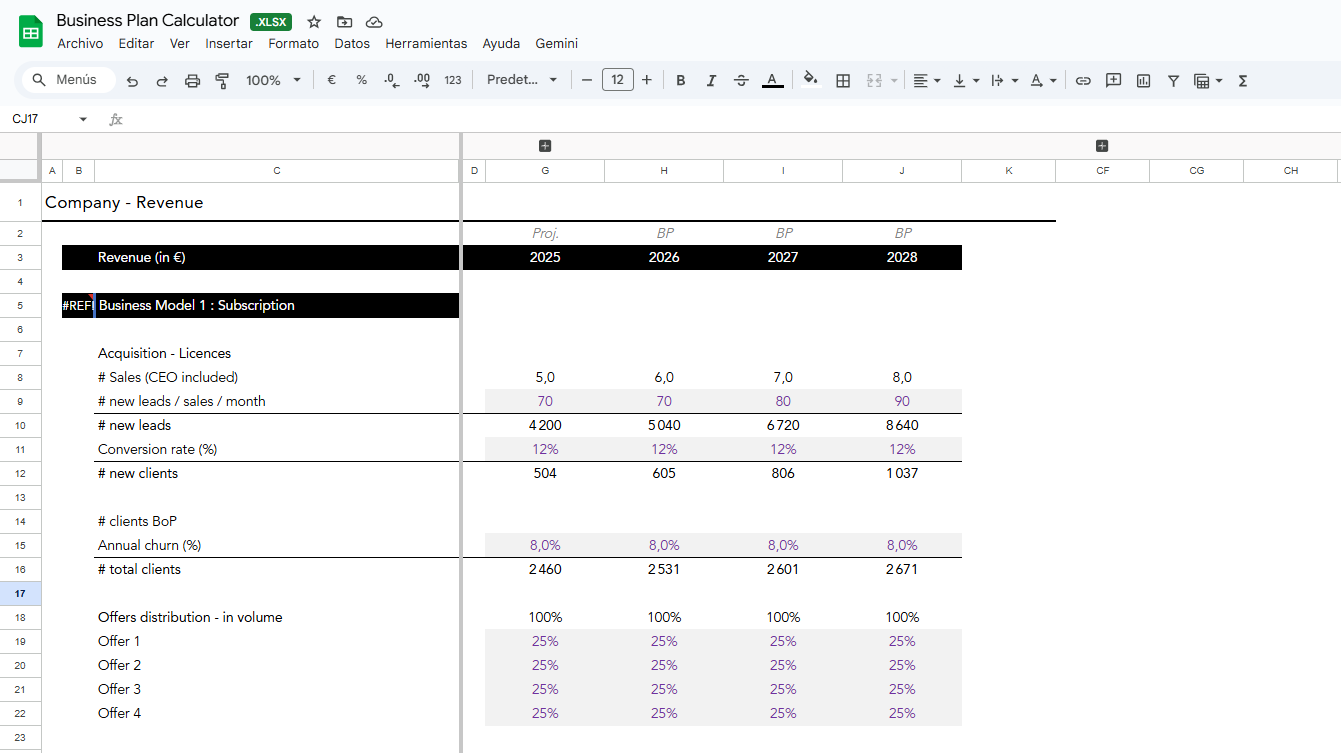
👉 A Business Plan & Financial Model Calculator (Excel) to translate assumptions into a coherent plan
This can be useful for:
Founders preparing or actively raising a Series A
Operators who want to understand how scaling companies are really evaluated
Anyone who wants a concrete view of how VCs make decisions about wether to invest in Series A Startups
Let’s get into it 🚀
1. Traction
One of the main things Series A investors evaluate is traction. At this stage, they want clear and repeatable proof that the product is working in the market, typically shown through growing and consistent MRR or ARR (one-off, transactional, or non-recurring fees excluded) and a steadily expanding base of paying customers.
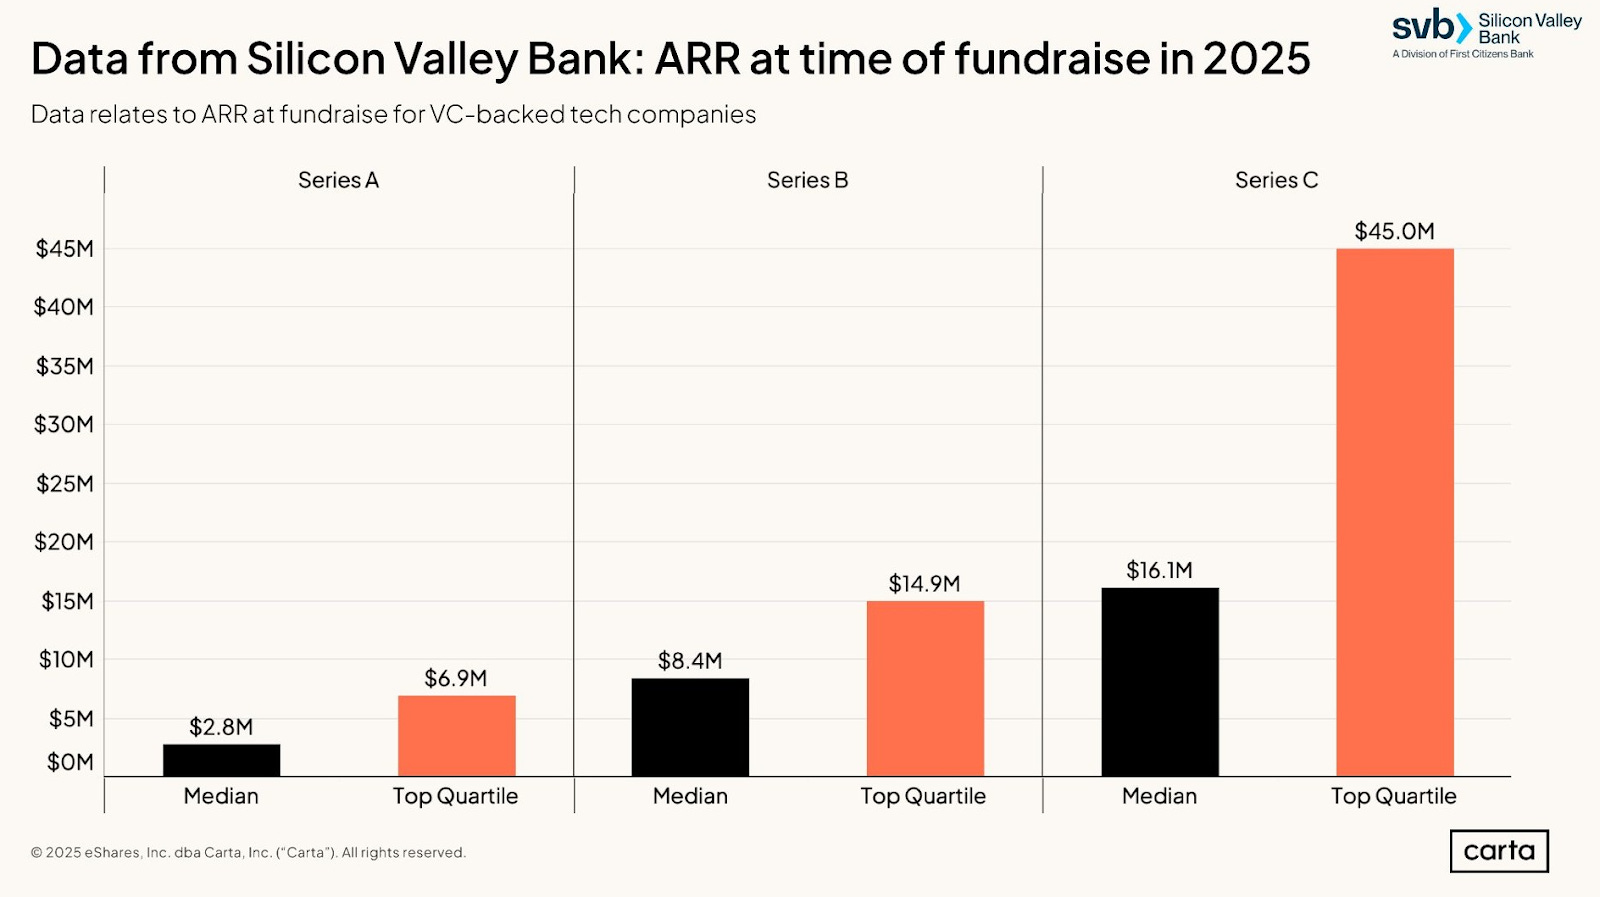
According to Carta data, the median company raising a Series A in the US is around $2.8M in ARR (roughly €2.4M). That said, the acceptable range is wider in practice, specially for non-US companies. As Christoph Janz, Partner at Point9 Capital, points out, many SaaS companies raise Series A between $1M and $2.5M in ARR, even less in some cases if the company is in a strong market or showing exceptional growth.
One important detail to be explicit about is whether you’re talking about ARR or CARR. Trying to blur the two usually backfires since investors will ask anyway.
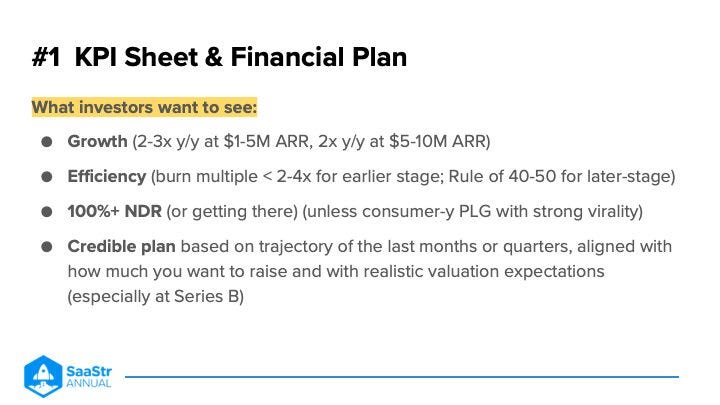
Growth rate also matters a lot because small differences compound fast.

Most Series A investors expect 7–15% month-over-month growth heading to the raise, with at least six months of relatively consistent growth they can extrapolate.
Growth should always be read in context: 30% MoM at $100K MRR is far more meaningful than 50% at $10K MRR. At around $1M ARR, this usually implies a credible path to roughly 3x ARR over the next 12 months (T2D3).

VCs play a power-law game, so they look for outliers that can turn early signals into hockey-stick growth rather than businesses on a linear path.
Beyond topline metrics, investors want to understand how revenue is actually generated. They’ll look closely at your sales cycle length, how it varies by channel (inbound, outbound, partners, PLG) and by customer type, and whether it’s becoming more efficient over time. Long or opaque sales cycles raise concerns, while clear improvements through PLG motions, self-serve onboarding, or sharper ICP focus are strong signals.
VCs also expect a clear and structured view of your pipeline. A common benchmark is 3–4x pipeline coverage per sales rep, along with the ability to compare forecasts versus actuals over recent quarters (to judge execution maturity). Breaking the pipeline down by channel helps investors judge which acquisition sources are working, how repeatable they are, and whether your go-to-market motion can scale predictably.
2. Product-Market Fit

Product-market fit is about whether customers consistently get enough value from the product to keep using and paying for it, and whether that demand is repeatable enough to scale. VCs will look for signals that usage and willingness to pay extend beyond a few early users and start showing organic pull.
Quantitative signals
Most of this assessment starts with data. The strongest signals usually include:
Retention: High retention is foundational. For SaaS, best-in-class companies often show annual retention above 90%. Investors rely on cohort analysis and retention curves to see whether retention holds or improves over time, and on leading usage indicators when history is still short. In mid-market and enterprise, net revenue retention or expansion revenue is a strong signal that customers are finding increasing value over time.

Fyxer AI’s Cohort Analysis showing 160% net dollar retention 
ChatGPT’s “smiling” customer retention curves Usage metrics: Are users coming back frequently and relying on the product to get something important done? Consistent usage often matters more than raw signups. For AI-native companies, investors may also examine the usage retention of AI features.
Unit-level economics: LTV relative to CAC helps assess whether the value created per customer justifies scaling acquisition, we’ll this cover in more detail in the next section.
Sean Ellis Test: Ask your users directly through surveys, messages, or even via your customer support team. If more than 40% say they would be very disappointed if the product disappeared, it’s a strong PMF signal.


Qualitative signals
These signals don’t replace metrics, but they often reinforce them:
Strong customer testimonials tied to specific use cases
Word-of-mouth or organic inbound demand, including internal or external recommendations
Credible press mentions or visible buzz in the ecosystem
3. Scalability and Unit Economics
Investors want to understand whether the business model can scale efficiently. That means having a repeatable way to acquire customers, clear growth levers to double down on, and unit economics that improve as volume increases.
These metrics help VCs see where growth comes from, how capital turns into revenue, and whether adding fuel actually accelerates the business rather than just increasing burn:
3.1. Revenue structure and scale
ACV (Annual Contract Value)
ACV is the annualized value of a typical customer contract at signing or renewal. It explains deal size and sales motion (few large contracts vs many small ones).ARPA (Average Revenue per Account)
ARPA = ARR or MRR / nº of active customers. It shows how revenue is distributed across the installed base and where value concentrates.
3.2. Margins and cost structure
Gross margin
Gross margin = (revenue – COGS) / revenue.
For SaaS, investors typically expect 75–85%+ over time.In AI-heavy products, margins depend on inference costs, model hosting, and humans-in-the-loop. What matters is showing clear visibility into variable AI costs and a credible path to margin expansion as usage scales, infra improves, or models get cheaper
3.3. Customer acquisition efficiency
CAC (Customer Acquisition Cost)
CAC = total sales and marketing spend / number of new customers acquired.
Investors expect clarity on how it’s calculated (e.g. fully loaded, blended vs by channel). Trends matter too, especially as you change GTM motion.CAC Payback Period
CAC payback = CAC / ( Monthly ARPA × Gross Margin)
Benchmark: under 12 months is considered strong for SaaS at Series A. Longer paybacks raise questions around capital intensity and scalability.
3.4. Customer value
LTV (Lifetime Value)
LTV = Annual ARPA × Gross Margin / Annual Churn.LTV / CAC
Shows whether acquisition is economically rational.
Benchmark: >3:1 is considered healthy. Below that, scaling typically destroys value.
3.4. Growth efficiency and capital discipline
Runway
Runway = cash available / net monthly burn.
Investors want enough runway post-raise to reach the next clear milestone without constant fundraising.Burn multiple (net burn / net new ARR)
A compact efficiency metric.
Early-stage benchmarks vary, but <2-4x is generally viewed as healthy.
4. Team

At Series A, investors look at whether the company has the people needed to execute the next phase of growth. This includes the founding team and, increasingly, the first layer of leaders around them.
The key question is whether responsibilities are clearly owned across product, engineering, sales, and operations, or if everything still depends on a few individuals. Strong signals come from having early hires who complement the founders and reduce execution bottlenecks.
Being able to attract high-quality talent early matters. It shows credibility, ambition, and that people with strong alternatives are willing to commit.
Advisors, angels, or board members also matter at this stage, but only insofar as they are active and relevant.
5. Market

In the Seed post we already covered how VCs assess whether a market is attractive, so there’s little new conceptually at Series A. You need to show you’re building in a market that can realistically support very large outcomes, typically a credible path to $300M+ in ARR and exits in the hundreds of millions or billions. Markets with hard ceilings or structurally capped returns quickly become non-starters.
Investors also expect a clear and honest view of the competitive landscape. Saying you have no competitors is usually a red flag. Strong signaling comes from showing you know the alternatives well, have tested them, understand what they do right, and can clearly explain where and why you can win.
6. Roadmap/Business Plan
Investors want to see a clear north star paired with a credible path to get there. Founders need to show how the business can realistically grow to $100M in revenue and beyond, starting from a focused niche and expanding into adjacent segments in a way that stays consistent with the product, go-to-market strategy, and financials.
That path is what the business plan captures, usually as a financial model, sometimes supported by a short narrative.
VCs don’t treat the business plan as a forecast, but as a structured set of assumptions around pricing, ACV, sales cycles, conversion rates, churn, expansion, hiring, and capital needs.
From there, investors typically rebuild the model more conservatively, stress-testing it through base, bear, and bull cases. This is where weak logic shows up fast:
Growth plans that require unrealistic hiring, margin expansion without cost leverage, or revenue acceleration without GTM capacity tend to break. A plan that holds together under this scrutiny is strong signaling, while obvious gaps can quickly stop a process.
7. How much to raise, valuation and timings
Round size and valuation
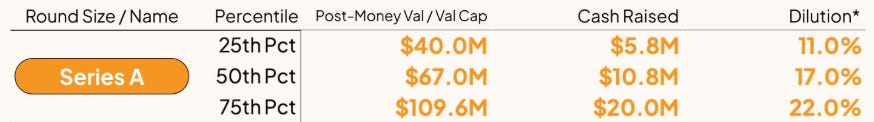
According to Carta’s data, Series A rounds typically land in the $5M–$15M range, with pre-money valuations often between $20M and $60M. These are not hard rules. Hot sectors, especially AI, and teams with exceptional traction can push well beyond these ranges, while companies in colder markets usually need stronger proof to reach similar outcomes.
The goal is to raise enough capital to comfortably reach the next clear milestone, and data shows the median time between Series A and B is around 2.6 years. A common mistake is optimizing for the biggest possible round. In practice, it’s often better to anchor slightly lower and let demand drive the round up. Oversubscribed rounds create leverage, optionality, and better outcomes than stretching targets upfront.
Timing and runway
You should aim to start fundraising with at least 6 months of cash left. Less than that weakens your position and compresses decision-making. Internally, the raise should line up with a clear inflection point in traction or execution, not just a cash deadline. Externally, being transparent about your timeline helps create urgency without name-dropping other funds.
Building momentum during the raise
Investors respond to visible acceleration. That can be metrics, hiring, product velocity, or customer wins, but it needs to be real and continuous. The strongest dynamic comes from setting conservative expectations and consistently beating them. Overpromising early and then missing numbers kills momentum fast. Underpromise, execute, and let the story compound week by week.
Relationship-building
Series A is rarely a cold-start process. The best outcomes usually come from relationships built 6+ months in advance, with investors who have already seen the company execute over time. As a rough benchmark, founders often see one term sheet for every 20+ quality investor conversations. Preparation, fast follow-ups, and tight answers matter more than volume.
8. Cap Table
At Series A and B, the cap table stops being a “who owns what” sheet and becomes a diligence document: it tells investors (1) whether founders still have enough ownership and incentives to keep pushing, (2) whether the company has spent equity efficiently so far, (3) whether there is enough room to keep hiring, and (4) whether the return math works in realistic exit scenarios.
What investors check first (Series A readiness): they want a fully diluted view that includes everything (common, preferred, options, SAFEs, notes, warrants), with clean terms and no hidden surprises. Typical cleanups before an A are converting outstanding SAFEs/notes into a clear fully diluted picture, dealing with dead equity (ex cofounders, ex employees, overpaid advisors), and making sure founder vesting is sensible (revesting comes up if everything vested too early). If this is messy, it slows diligence and kills trust.
The option pool and ESOP are the biggest dilution lever. Investors often push for an option pool top up pre money, which dilutes founders more than the new investor. The only way to negotiate it well is to show a concrete hiring plan to the next round and size the pool to that plan. Practical benchmarks from Index style data: many plans target 10–15% ESOP around Series A to cover hires until Series B. The key is that the pool should be justified by hires, not rounded up “just in case”.
Waterfall modeling is what makes the cap table real. For any meaningful discussion at Series A/B, you should model exits at a few price points (for example $50M, $100M, $300M+) and show who gets paid what, given preferences and the current preference stack.
Beyond ownership, investors scrutinize the terms attached to that ownership. At Series A, the baseline most founders should push for is a 1x non-participating liquidation preference, broad-based weighted-average anti-dilution, and a balanced board (often 2 founders, 2 investors, and 1 independent). These terms define downside protection and control long before they show up in outcomes.
Strong founders also pressure-test terms, not just valuations. That means modeling exits across different price points to understand how liquidation preferences, anti-dilution, and stacked rights affect founder payouts, and pushing back on clauses that enable excessive control or cumulative preferences. “Market standard” only matters if you understand what it does in practice.
9. Data Room

By Series A, investors expect a clean, well-structured data room that reflects how seriously you run the company. At a minimum, this includes the financial model and unit economics, a clean cap table, the business plan and roadmap, the pitch deck (with a strong appendix), sales pipeline and GTM data, product and tech stack documentation, and all key legal and IP materials.
Unlike at seed, presentation and data quality now matter: clear models, consistent numbers, and easy access to supporting documents speed up diligence, build confidence, and can materially shorten the time to close once a term sheet is signed.
RESOURCES
👉 Pitch decks that companies like Vercel, Databricks, Alan, Profound, and Artisan, used to raise their Series A from tier-1 investors
👉 A Series A Cap Table Calculator (Excel) to model dilution, ownership, and exit outcomes
👉 A Business Plan & Financial Model Calculator (Excel) to translate assumptions into a coherent plan